除錯
使用 Python 除錯器
You can configure Litestar to drop into the Python Debugger when an exception occurs. This can be configured in different ways:
- Configuring
Litestarwith thepdb_on_exceptionoption app = Litestar(pdb_on_exception=True)- 使用 CLI 執行您的應用程式並搭配
--pdb旗標 litestar run --pdb- 使用
LITESTAR_PDB環境變數 LITESTAR_PDB=1
使用 IDE 進行除錯
You can easily attach your IDEs debugger to your application, whether you're running it via the CLI or a webserver like uvicorn.
Intellij / PyCharm
使用 CLI
Create a new debug configuration via
Run>Edit ConfigurationsSelect
Module nameoption and set it tolitestarAdd the
runparameter and optionally additional parameters you want to pass to the CLI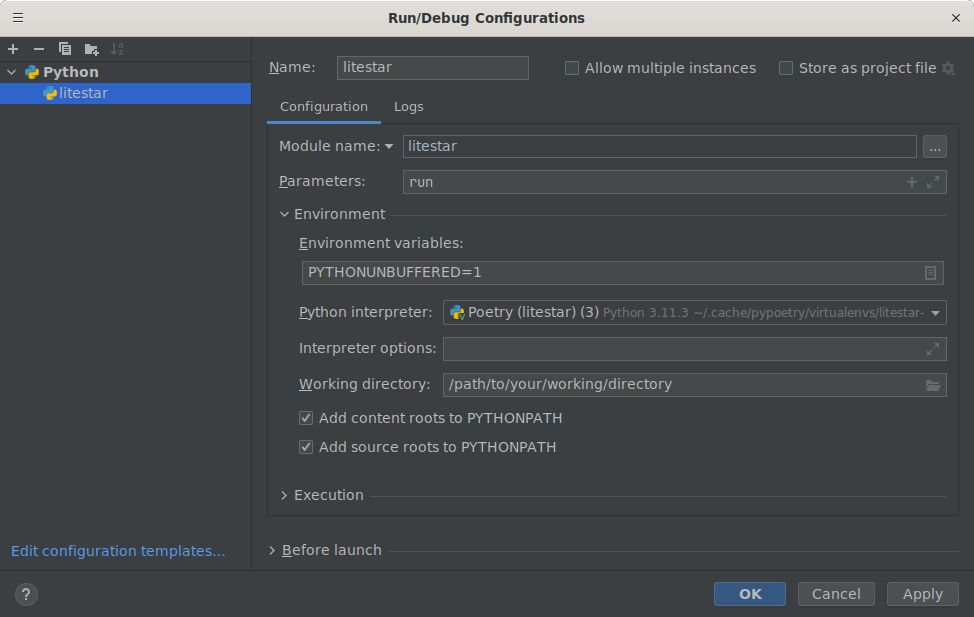
Run your application in the debugger via
Run>Debug Litestar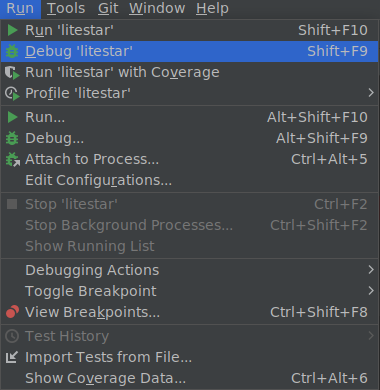
重要
Breakpoints inside route handlers might not work correctly when used in conjunction
with the --reload and --web-concurrency parameters. If you want to use the
CLI while making use of these options, you can attach the debugger manually to the
running uvicorn process via Run > Attach to process.
使用 uvicorn
Create a new debug configuration via
Run>Edit ConfigurationsSelect
Module nameoption and set it touvicornAdd the
app:appparameter (or the equivalent path to your application object)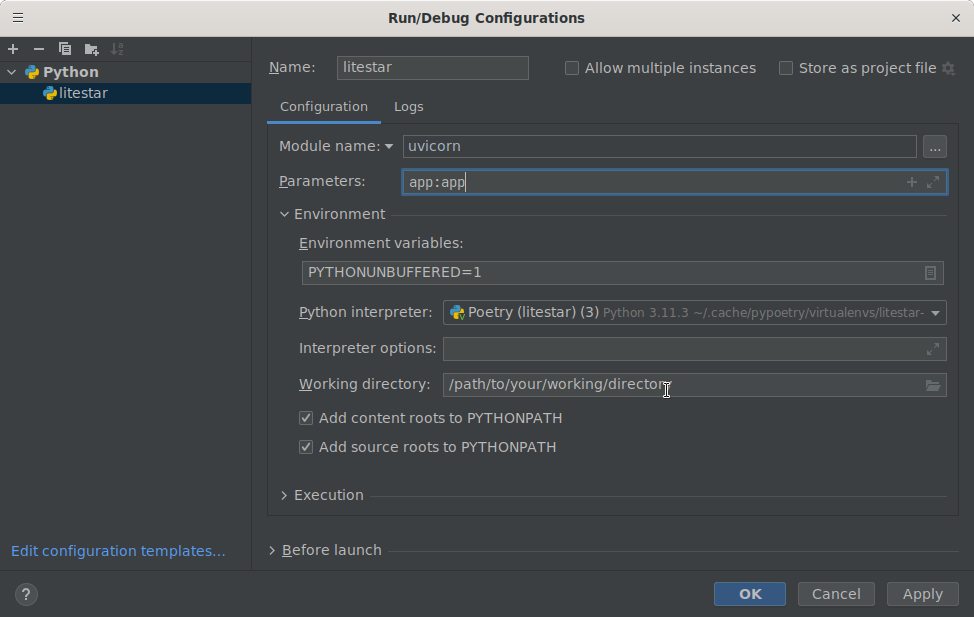
Run your application in the debugger via
Run>Debug Litestar
VS Code
使用 CLI
- Add a new debugging configuration via
Run>Add configuration 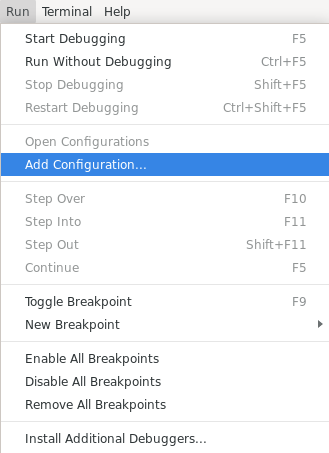
- Add a new debugging configuration via
- From the
Select a debug configurationdialog, selectModule 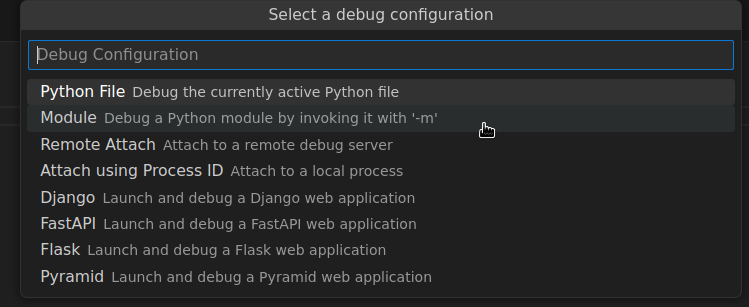
- From the
- Enter
litestaras the module name 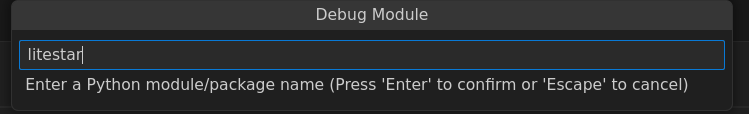
- Enter
- In the opened JSON file, alter the configuration as follows:
{
    "name": "Python: Litestar app",
    "type": "debugpy",
    "request": "launch",
    "module": "litestar",
    "justMyCode": true,
    "args": ["run"]
}
- Run your application via the debugger via
Run>Start debugging 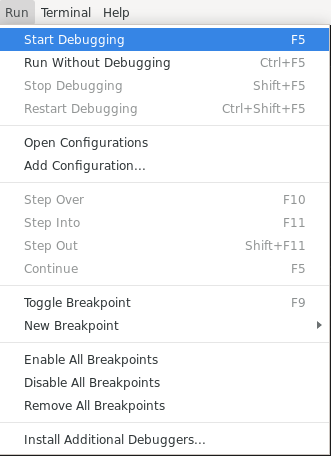
- Run your application via the debugger via
使用 uvicorn
- Add a new debugging configuration via
Run>Add configuration -
- Add a new debugging configuration via
- From the
Select a debug configurationdialog, selectModule -
- From the
- Enter
uvicornas the module name -
- Enter
- In the opened JSON file, alter the configuration as follows:
{
    "name": "Python: Litestar app",
    "type": "debugpy",
    "request": "launch",
    "module": "uvicorn",
    "justMyCode": true,
    "args": ["app:app"]
}
- Run your application via the debugger via
Run>Start debugging -
- Run your application via the debugger via
Customizing the debugger
You can configure Litestar with the debug_module option to enable interactive debugging. Currently, it supports the following debugging tools: ipdb, PuDB and pdbr. Also supports pdb++. The default value is pdb.
import ipdb


app = Litestar(pdb_on_exception=True, debugger_module=ipdb)